
Temperature Sensor Experiments
(Wayne's World!)
Digital Multimeter from Radio Shack (item #
22-812) for $70.00 US.
It has an RS-232 interface that can be connected to a PC and software that
"talks" to the meter and shows the results on the PC's screen.

I hooked the meter to a Water Temperature Sensor
and put it in a glass of water at 20C
with a thermometer. I put the glass on my coffee cup warmer and watched the
resistance change as the temperature changed. A really neat tool!
Pictures attached.
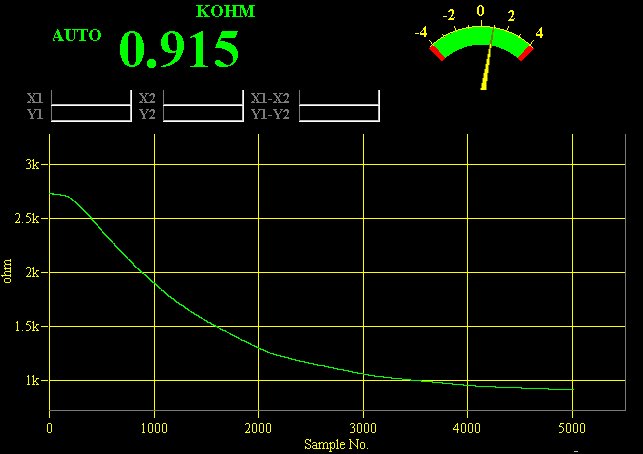
This graph shows the beginning resistance of the Water Temperature Sensor at 19C
and
the coffee warmer raised the temp to 50C in 5,000 seconds.
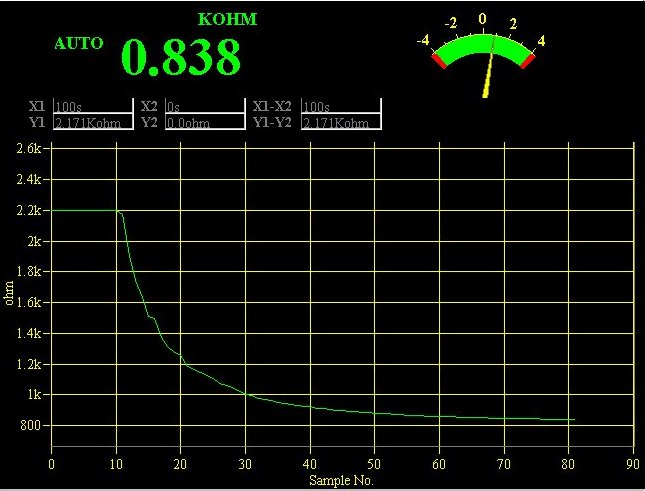
This graph shows the beginning resistance of the Water Temperature Sensor at
room
temperature of 21C and then the WTS was placed in the water at a temperature of
50C
it then took 80 seconds to stabilize.
Note: when immersing in 50°C water, it takes 18 samples to change from
2kohms to 1kohm.

The graph shows the beginning resistance of the Water Temperature Sensor at room
temperature of
21C and then the WTS was placed in the water at a temperature of 90C it then
took 80 seconds to
stabilize.
Note: when immersing in 90°C water, it takes 4 samples to change from 2kohms
to 1kohm.
This WTS came out of a Mazda Protégé that kept
having the "Check Engine" light come on as
the engine warmed up. Once it warmed up if you cleared the stored error
codes the light would stay off.
Note the two "blips" around the 15
second mark! A rapid change in temperature caused the
thermistor to hick-up and confuse the Mazda ECU!
Math Fun (Philip enters Wayne's World)
There is a great piece of software called Curve Expert. You can get it here .
I will use Curve Expert to find an equation that models the resistance vs. temperature for the first example.
Here is the data:
Graph of sensor warming from 20°C to 50°C
Assumptions in the graph:
So
The rate of temp increase is 30° in 4900 samples or 0.0061°/sample
Here is a quick and dirty table showing the data:
| Time (offset by 200 samples or 100sec) |
Temp °C |
Resistance ohms |
| 0 | 20 | 2700 |
| 500 | 23 | 2200 |
| 1000 | 26 | 1750 |
| 1500 | 29 | 1500 |
| 2000 | 32 | 1250 |
| 2500 | 35 | 1100 |
| 3000 | 38 | 1050 |
| 3500 | 41 | 950 |
| 4000 | 44 | 800 |
| 4500 | 47 | 750 |
| 5000 | 50 | 750 |
Here is the data plugged into the Curve
Expert program:
Data table (x=temp and y=resistance)
Plot of the data (fit = 99.911)
Formula that represents the data
So plugging in for x = 10°C the resistance will be:
352.81931 + (-0.46402548 * 10C) + (955632.72 / (10C *10C))
= 9905.5 ohms